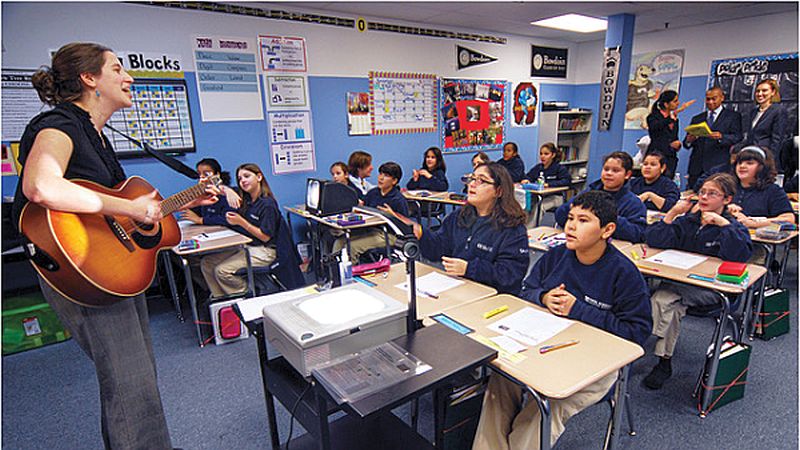
A classroom at Excel Academy in East Boston, taken during 2009 visit by Gov. Deval Patrick (among observers at back of the room). (Chris Lovett photo)
New studies show a Greater Boston population becoming more racially diverse, but also more disconnected by income, and by shifting educational choices following the Covid-19 pandemic. As multiple figures show, the “big sort” declared more than twenty years ago is diverging into new patterns, whether in high-income suburbs or in Boston schools.
According to Boston Indicators, the research center at the Boston Foundation, the region’s economic polarization has been increasing for decades, while middle-income and school-age populations within the City of Boston have declined. During those years, enrollment in all of Boston’s public schools –including charters – has become steadily more dominated by students from low-income families.
In looking over the past 40 years, Boston Indicators found growth in the region’s shares of high- and low-income households. In line with a national trend, the “significant income polarization” bookends a shrinking middle-income segment, with Boston’s being the fourth smallest among major US metro areas.
As measured by Boston Indicators, the metro area’s high-income segregation has more than doubled since 1980, increasing even more sharply since 2020. “Wealthier households,” researchers explained, “are increasingly concentrated together, driving much of the overall increase in income segregation across the region.”
According to a study from the spring of 2025 by Boston University’s Wheelock Educational Policy Center (WEPC), public school enrollment in Massachusetts between 2020 and 2024 declined by 2 percent, with private and parochial school enrollment increasing by 14 percent. WEPC researchers found “widespread” drops in public school enrollment, but more prevalent in high-income suburbs. The enrollment shifts also overlapped with a long-term trend of family sizes becoming smaller.
Though they report that public-school enrollment in low-income districts has “largely recovered,” WEPC researchers found that statewide declines below pre-pandemic levels had “stabilized” overall for white students at 3 percent and for Asian students by 8 percent. Researchers called the trend among white and Asian students a “persistent exodus,” warning that “the pandemic has substantially shifted the racial/ethnic composition of public schools.”
According to their working paper, the results from Massachusetts mirror a national trend: “The sustained decline in public school enrollment observed here is consistent with evidence that Americans, including K–12 parents, have lower satisfaction with schools even years after school closures ended.
Contrary to the larger patterns cited by WEPC, there’s little decrease in the share of Boston students attending all kinds of public schools, including charter schools and suburban district schools participating in the METCO voluntary desegregation program.
In 2024-25, the share of Boston’s combined public-school attendance was 86.4 percent, slightly higher than the DESE figure for 2005-06 and slightly below the figure for 2018-19. The more dramatic changes were in the total number of Boston students enrolled in all types of K-12 schools: down by 16.5 percent over the past 20 years; 15.3 percent since 2018-19; and 4.2 percent since 2022-23.
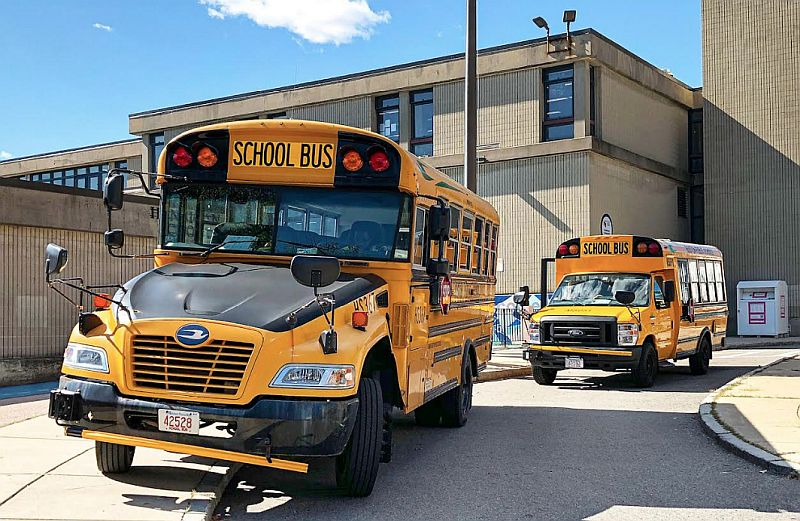
School buses outside the Hennigan K-6 School in JP. (Chris Lovett photo)
According to figures from the state’s Department of Elementary and Secondary Education (DESE), the largest decrease in BPS enrollment between 2018-19 and 2024-25 was in Black students, a drop of 2,572 or about 16 percent, including five in-district charter schools.
Over the same period in the BPS, enrollment has fallen for all the largest racial groups, with white students down by 989 (13 percent) and “Hispanic” students by the same count, but by 4.4 percent. The drop for smaller population of Asian students was 873, but almost 19 percent—the highest share any group.
The drop in “Hispanic” students took place amid an overall increase over the past two decades. Since 2005-06, the number of Black students in the BPS district schools has decreased by 11,224 or 45.7 percent—almost as large as the overall drop in the district’s total enrollment, 11,255 (19.6 percent). Overlapping with years of increased enrollment in charter schools, the figure could also reflect growing numbers of students identifying as “multi-racial.” Over the same two decades, enrollment for white students was down by 16.1 percent and, for Asian students, by 24.3 percent.
The WEPC highlighted another trend since the start of the pandemic: the disproportionate exodus from middle grades (5-8).
“Survey evidence thus suggests that, if anything, parents’ and school leaders’ perceptions of public school learning environments may be worse now than in the first year or two after the pandemic’s onset,” WEPC researchers commented. “Concerns about student behavior are particularly acute in middle schools, consistent with enrollment declines concentrated in such grade levels. The subset of parents turning to private schools and home schooling may be doing so in part to find their children a safer and less disrupted learning environment.”
In the BPS, middle-grade enrollment has fallen over the last twenty years by 28.4 percent, well above the figure for all grades. Between 2018-2019 and 2024-25, the decrease, according to DESE’s district figures, was 12 percent, but accounting for more than one-third of the middle-grade drop over the past two decades.
Over a three-year period—from 2022-23 to 2024-25–DESE figures show Boston enrollment at in-state private and parochial schools increased by 22.2 percent, though the number of these students was still below the pre-pandemic total. During the same three years, the BPS figure was down by 12.1 percent, with enrollment in Boston charter schools up by 9.4 percent and enrollment in public schools outside the district up by 11 percent.
Reflecting another change in years after the pandemic was a statewide poll released in November 2023 by The Education Trust in Massachusetts (EdTrust), showing a clear racial gap in parent expectations for learning beyond high school.
According to the survey of parents with children in grades 6-12, by MassINC Polling Group, only 37 percent of Latino parents reported that their children were interested in pursuing a four-year college degree. For low-income Latino parents, the figure was 26 percent, well below the figure for all Asian parents (71 percent) and white parents (59 percent).
“Merely a few years ago, Latino students were enrolling in colleges and universities across the Commonwealth in record numbers. But that figure dropped from 55 percent enrollment in 2018-19 to 39 percent in 2021-2022,” said Amanda Fernandez, CEO/founder of Latinos for Education, in a statement released by EdTrust. “With the cost of attending colleges and universities continuing to increase dramatically — and this latest poll adding to the growing evidence that parents are concerned about how to pay for tuition, books, and basic needs — it’s hardly a surprise that Latino parents believe obtaining a degree isn’t in the cards.”
But, among Boston’s higher-income families, the exodus from the BPS or the whole city was noted in a Boston Indicators report from 2020. Between 1980 and 2017, according to researchers, the city lost almost 6,000 middle-income households with children, while gaining a slightly higher number of low-income families. There was a much smaller increase in high-income families with children, but the largest increase was in high-income households without kids.
The 2020 report showed that, between 1995 and 2014, the share of low-income students in all types of Boston public schools increased from 61 percent to 77 percent. For Boston’s district schools in 2024-25, DESE lists 70.1 percent of the students as low-income, with 81.6 percent as “High Needs,” which includes language learners and students with learning disabilities. In 2015, the figure for “economically disadvantaged” students in the BPS was only 49.3 percent.
Using pre-pandemic data, the 2020 report noted that the exodus of families with children from the city took place even during years when performance indicators for the BPS, despite racial disparities, were improving overall.
In 2012, officials in Boston changed the BPS student assignment process to combine more parental choice with more access to “neighborhood” schools. At meetings around the city, officials argued that the range of choice would create more incentive for schools to improve performance, resulting in more educational equality. But they also acknowledged that many of the least chosen schools, regardless of performance, were in neighborhoods with the bulk of the district’s mainly Black and Latino population. And, as a Boston Indicators report would later surmise, school choices may have also been swayed by racial bias.
“With an eye toward higher education, parents today may be more critical in assessing the quality of local schools than they were in previous generations, despite some real improvements to student outcomes,” according to the 2020 report. “Their worry on this front is possibly leading more of them to consider settling outside in suburbs of the city with better resourced public school systems.”
In a post from July of this year on changes since the pandemic, education blogger Will Austin found reason to worry for all parents. “Like busing in the 1970s,” he wrote, “future generations will likely debate the impact of the pandemic on public schooling.
We are probably too close to history now to understand, hypothesize, or extrapolate… But greater segregation by wealth is most certainly impacting students, families, and systems now.”
Scores from the 2025 MCAS test show modest gains for the BPS in early grades and a small decline overall for grade 10, though the results are still below pre-pandemic levels. At the Upper Henderson K-12 Inclusion School in Dorchester, the share of students meeting or exceeding expectations was down sharply from 2018-19, with figures dropping for English Language Arts (ELA), from 43 to18 percent, and Math, from 42 to 14 percent.
BPS attendance has improved, with chronic absenteeism, i.e., missing at least 10 percent of school days, falling since 2021-22 from 42.2 to 33 percent. But that’s still above figures for the pre-pandemic decade, between 24 and 26 percent.
In an Oct. 3 post, Austin pointed out that MCAS results from several individual BPS schools surpassed the statewide average, including schools that mainly serve low-income and high-needs students. A standout among local charter schools was Excel Academy, with campuses in East Boston and Chelsea, which “erased” pandemic-related learning deficits in English and Math, according to the Mass. Charter Public School Assn. Almost two-thirds of Excel’s students are “low-income” and more than 81 percent are listed by DESE as “Hispanic or Latino” and “high needs.”
Austin also cited one more education metric, from a pre-election Boston Globe/Suffolk University public opinion survey in July. The poll found that 12.6 percent of the sample ranked “schools/education” as the most important issue affecting their vote—less than half the figure for housing and 4.6 below the figure for the economy and jobs.
“Probably most significantly,” Austin noted, “this is the lowest ranking of education by Boston voters in the last four mayoral election cycles.”
The 2025 Boston Indicators report found possible advantages to demographic clustering, but also a downside. “Segregation isn’t just a backdrop,” researchers observed. “It influences who benefits from our policies and who gets left out.”
According to Boston Indicators, the racial divide within the BPS has been growing since 1980. As researchers described it in 2020, “white and Asian students are ending up together in many of the same schools, while Black and Latino students are becoming more isolated from other groups.”
The history of sorting is even longer for BPS exam schools, through recalibrations of selectivity and inclusion in admissions policies. The changes since the start of the pandemic have made the pool of applicants and admissions more reflective of the city’s racial and economic mix, even shifting the balance of admissions between different neighborhoods. But the changes also led to a drop in applicants from the city’s highest income tiers, and to a number of applicants with extremely high composite scores—based on grades and a standardized test—failing to be admitted.
As currently proposed by the BPS administration, the latest version of the policy would still admit top-scoring students from different socio-economic tiers, but also set aside 20 percent of the seats at each exam school for top-scoring applicants citywide. As in past years, recent public debate over the recommended changes has focused on how to meet demand for more rigorous learning without less advantaged students being excluded or stuck in a less challenging track.
At a Sept. 29 City Council hearing on the changes, education advocate and researcher Roseann Tung drew a connection between admissions, test results, household income, and where students live. “Exam schools structure the BPS into a tiered education system…,” she reasoned. “And the demographics are as you would expect.”
Councillor At-Large Julia Mejia described her daughter’s experience at an exam school as an honor-roll student eager to prove she was admitted on account of merit rather than a socio-economic formula.
“I think that we get so caught up with the idea and the illusion of fairness, whereas you are already faring far better than some students just based on where you live, the type of parental household you grew up in,” Mejia lamented, “so the system already is stacked against you, just because of who you are and how you grew up, and where you grow up.”
At the same hearing, Colin Rose, the BPS senior advisor for strategy and opportunity gaps, reflected on his earlier work helping students surmount a socio-economic divide through programs to boost achievement.
“The biggest challenge, I think, is making sure that everybody sees the talent in our students,” he told councillors. “I always say talent is evenly distributed, but opportunity is not.”
By Chris Lovett, Reporter Correspondent
October 8, 2025
Source: